None.
| (1) |
Open in the MATLAB editor: d02tz_example
function d02tz_example


fprintf('d02tz example results\n\n');

global alpha beta eps; % For communication with local functions

% Initialize variables and arrays.
neq  = int64(1);
nlbc = int64(1);
nrbc = int64(1);
ncol = int64(5);
mmax = int64(2);
m    = int64([2]);
tols = [1.0e-05];

% Set values for problem-specific physical parameters.
alpha = -1/3;
beta  =  1/3;
eps   = 1e-3;

% Set up the mesh.
nmesh  = int64(7);
mxmesh = int64(50);

% Set location of mesh points, and specify which are fixed.
mesh =   zeros(mxmesh, 1);
ipmesh = zeros(mxmesh, 1, 'int64');
mesh(1:nmesh) =  [0.0; 0.15; 0.3; 0.5; 0.7; 0.85; 1.0];
ipmesh(1:2:nmesh) = 1;
ipmesh(2:2:nmesh) = 2;

% Prepare to store results for plotting.
xarray = zeros(1,1);
yarray = zeros(1,2);

% d02tv is a setup routine to be called prior to d02tk.
[work, iwork, ifail] = d02tv( ...
                              m, nlbc, nrbc, ncol, tols, nmesh, mesh, ipmesh);
ncont = 2;

% We run through the calculation ncont times with different parameter sets.
for jcont = 1:ncont

  eps = 0.1*eps;
  fprintf('\n Tolerance = %8.1e, eps = %10.3e\n\n', tols(1), eps);

  % Call d02tk to solve BVP for this set of parameters.
  [work, iwork, ifail] = d02tk( ...
                                @ffun, @fjac, @gafun, @gbfun, @gajac, ...
                                @gbjac, @guess, work, iwork);
  % Call d02tz to extract mesh from solution.
  [nmesh, mesh, ipmesh, ermx, iermx, ijermx, ifail] = ...
  d02tz( ...
         mxmesh, work, iwork);

    % Output mesh results.
  fprintf(' Used a mesh of %d points\n', nmesh);
  fprintf(' Maximum error = %10.2e in interval %d for component %d\n\n',...
          ermx, iermx, ijermx);

  % Output solution, and store it for plotting.
  fprintf(' Solution and derivative at every second point:\n');
  fprintf('      x        u          u''\n');
  for imesh = 1:nmesh

    % Call d02ty to perform interpolation on the solution.
    [y, work, ifail] = d02ty( ...
                              mesh(imesh), neq, mmax, work, iwork);
    if mod(imesh, 2) ~= 0
      fprintf(' %8.4f   %8.5f   %8.5f\n', mesh(imesh), y(1,1), y(1,2));
    end
    xarray(imesh) = mesh(imesh);
    yarray(imesh, :) = y(1, :);
  end

  % Plot results for this parameter set.
  if jcont==1
    fig1 = figure;
  else
    fig2 = figure;
  end
  display_plot(xarray, yarray, eps)

  % Select mesh for next calculation.
  if jcont < ncont
    nmesh = (nmesh+1)/2;

    % d02tx allows the current solution to be used as an initial
    % approximation to the solution of a related problem.
    [work, iwork, ifail] = d02tx( ...
                                  nmesh, mesh, ipmesh, work, iwork);
  end
end


function [f] = ffun(x, y, neq, m)
  % Evaluate derivative functions (rhs of system of ODEs).

  global eps
  f = zeros(neq, 1);
  f(1) = (y(1,1) - y(1,1)*y(1,2))/eps;

function [dfdy] = fjac(x, y, neq, m)
  % Evaluate Jacobians (partial derivatives of f).

  dfdy = zeros(neq, neq, 1);

  machep = x02aj;
  fac = sqrt(machep);
  for i = 1:neq
    yp(i,1:m(i)) = y(i,1:m(i));
  end

  for i = 1:neq
    for j = 1:m(i)
      ptrb = max(100*machep, fac*abs(y(i,j)));
      yp(i,j) = y(i,j) + ptrb;
      f1 = ffun(x, yp, neq, m);
      yp(i,j) = y(i,j) - ptrb;
      f2 = ffun(x, yp, neq, m);
      dfdy(:,i,j) = 0.5*(f1- f2)/ptrb;
      yp(i,j) = y(i,j);
    end
  end

function [ga] = gafun(ya, neq, m, nlbc)
  % Evaluate boundary conditions at left-hand end of range.

  global alpha beta
  ga = zeros(nlbc, 1);
  ga(1) = ya(1,1) - alpha;

function [dgady] = gajac(ya, neq, m, nlbc)
  % Evaluate Jacobians (partial derivatives of ga).

  dgady = zeros(nlbc, neq, 2);
  dgady(1,1,1) = 1;

function [gb] = gbfun(yb, neq, m, nrbc)
  % Evaluate boundary conditions at right-hand end of range.

  global alpha beta
  gb = zeros(nrbc, 1);
  gb(1) = yb(1,1) - beta;

function [dgbdy] = gbjac(yb, neq, m, nrbc)
  % Evaluate Jacobians (partial derivatives of gb).

  dgbdy = zeros(nrbc, neq, 2);
  dgbdy(1,1,1) = 1;

function [y, dym] = guess(x, neq, m)
  % Evaluate initial approximations to solution components and derivatives.

  global alpha beta
  y = zeros(neq, 2);
  dym = zeros(neq, 1);
  y(1,1) = alpha + (beta - alpha)*x;
  y(1,2) = beta - alpha;
  dym(1) = 0;

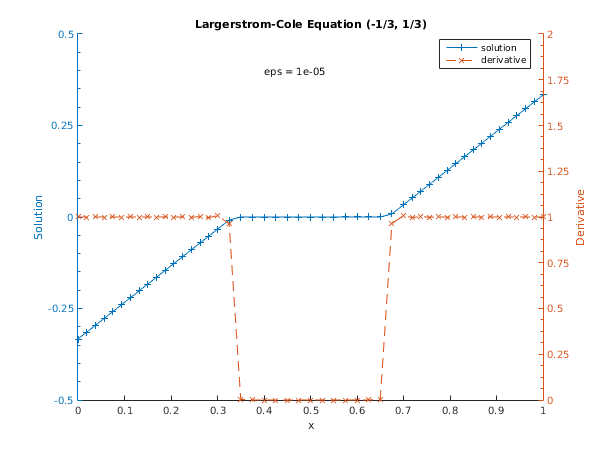
function display_plot(x, y, eps)
  % Plot the results.
  [haxes, hline1, hline2] = plotyy(x, y(:,1), x, y(:,2));
  % Set the axis limits and the tick specifications to beautify the plot.
  set(haxes(1), 'YLim', [-0.5 0.5]);
  set(haxes(1), 'YMinorTick', 'on');
  set(haxes(1), 'YTick', [-0.5 -0.25 0 0.25 0.5]);
  set(haxes(2), 'YLim', [0 2]);
  set(haxes(2), 'YTick', [0 0.25 0.5 0.75 1.0 1.25 1.5 1.75 2]);
  set(haxes(2), 'YMinorTick', 'on');
  for iaxis = 1:2
    % These properties must be the same for both sets of axes.
    set(haxes(iaxis), 'XLim', [0 1]);
  end
  set(gca, 'box', 'off')
  % Add title.
  title('Largerstrom-Cole Equation (-1/3, 1/3)');
  text(0.4,0.4,['eps = ', num2str(eps)]);
  % Label the axes.
  xlabel('x');
  ylabel(haxes(1), 'Solution');
  ylabel(haxes(2), 'Derivative');
  % Add a legend.
  legend('solution','derivative','Location','Best');
  % Set some features of the three lines.
  set(hline1, 'Linewidth', 0.25, 'Marker', '+', 'LineStyle', '-');
  set(hline2, 'Linewidth', 0.25, 'Marker', 'x', 'LineStyle', '--');
d02tz example results


 Tolerance =  1.0e-05, eps =  1.000e-04

 Used a mesh of 25 points
 Maximum error =   2.15e-06 in interval 16 for component 1

 Solution and derivative at every second point:
      x        u          u'
   0.0000   -0.33333    1.00000
   0.0750   -0.25833    1.00000
   0.1500   -0.18333    1.00000
   0.2250   -0.10833    1.00002
   0.3000   -0.03332    1.00372
   0.4000   -0.00001    0.00084
   0.5000   -0.00000    0.00000
   0.6000    0.00001    0.00084
   0.7000    0.03332    1.00372
   0.7750    0.10833    1.00002
   0.8500    0.18333    1.00000
   0.9250    0.25833    1.00000
   1.0000    0.33333    1.00000

 Tolerance =  1.0e-05, eps =  1.000e-05

 Used a mesh of 49 points
 Maximum error =   2.11e-06 in interval 32 for component 1

 Solution and derivative at every second point:
      x        u          u'
   0.0000   -0.33333    1.00014
   0.0375   -0.29583    1.00018
   0.0750   -0.25833    1.00022
   0.1125   -0.22083    1.00029
   0.1500   -0.18333    1.00040
   0.1875   -0.14583    1.00059
   0.2250   -0.10833    1.00098
   0.2625   -0.07083    1.00202
   0.3000   -0.03333    1.00745
   0.3500   -0.00001    0.00354
   0.4000   -0.00000    0.00000
   0.4500   -0.00000    0.00000
   0.5000    0.00000   -0.00000
   0.5500    0.00000    0.00000
   0.6000    0.00000    0.00000
   0.6500    0.00001    0.00354
   0.7000    0.03333    1.00745
   0.7375    0.07083    1.00202
   0.7750    0.10833    1.00098
   0.8125    0.14583    1.00059
   0.8500    0.18333    1.00040
   0.8875    0.22083    1.00029
   0.9250    0.25833    1.00022
   0.9625    0.29583    1.00018
   1.0000    0.33333    1.00014

